Every Movie Released in 2024
December 20, 2024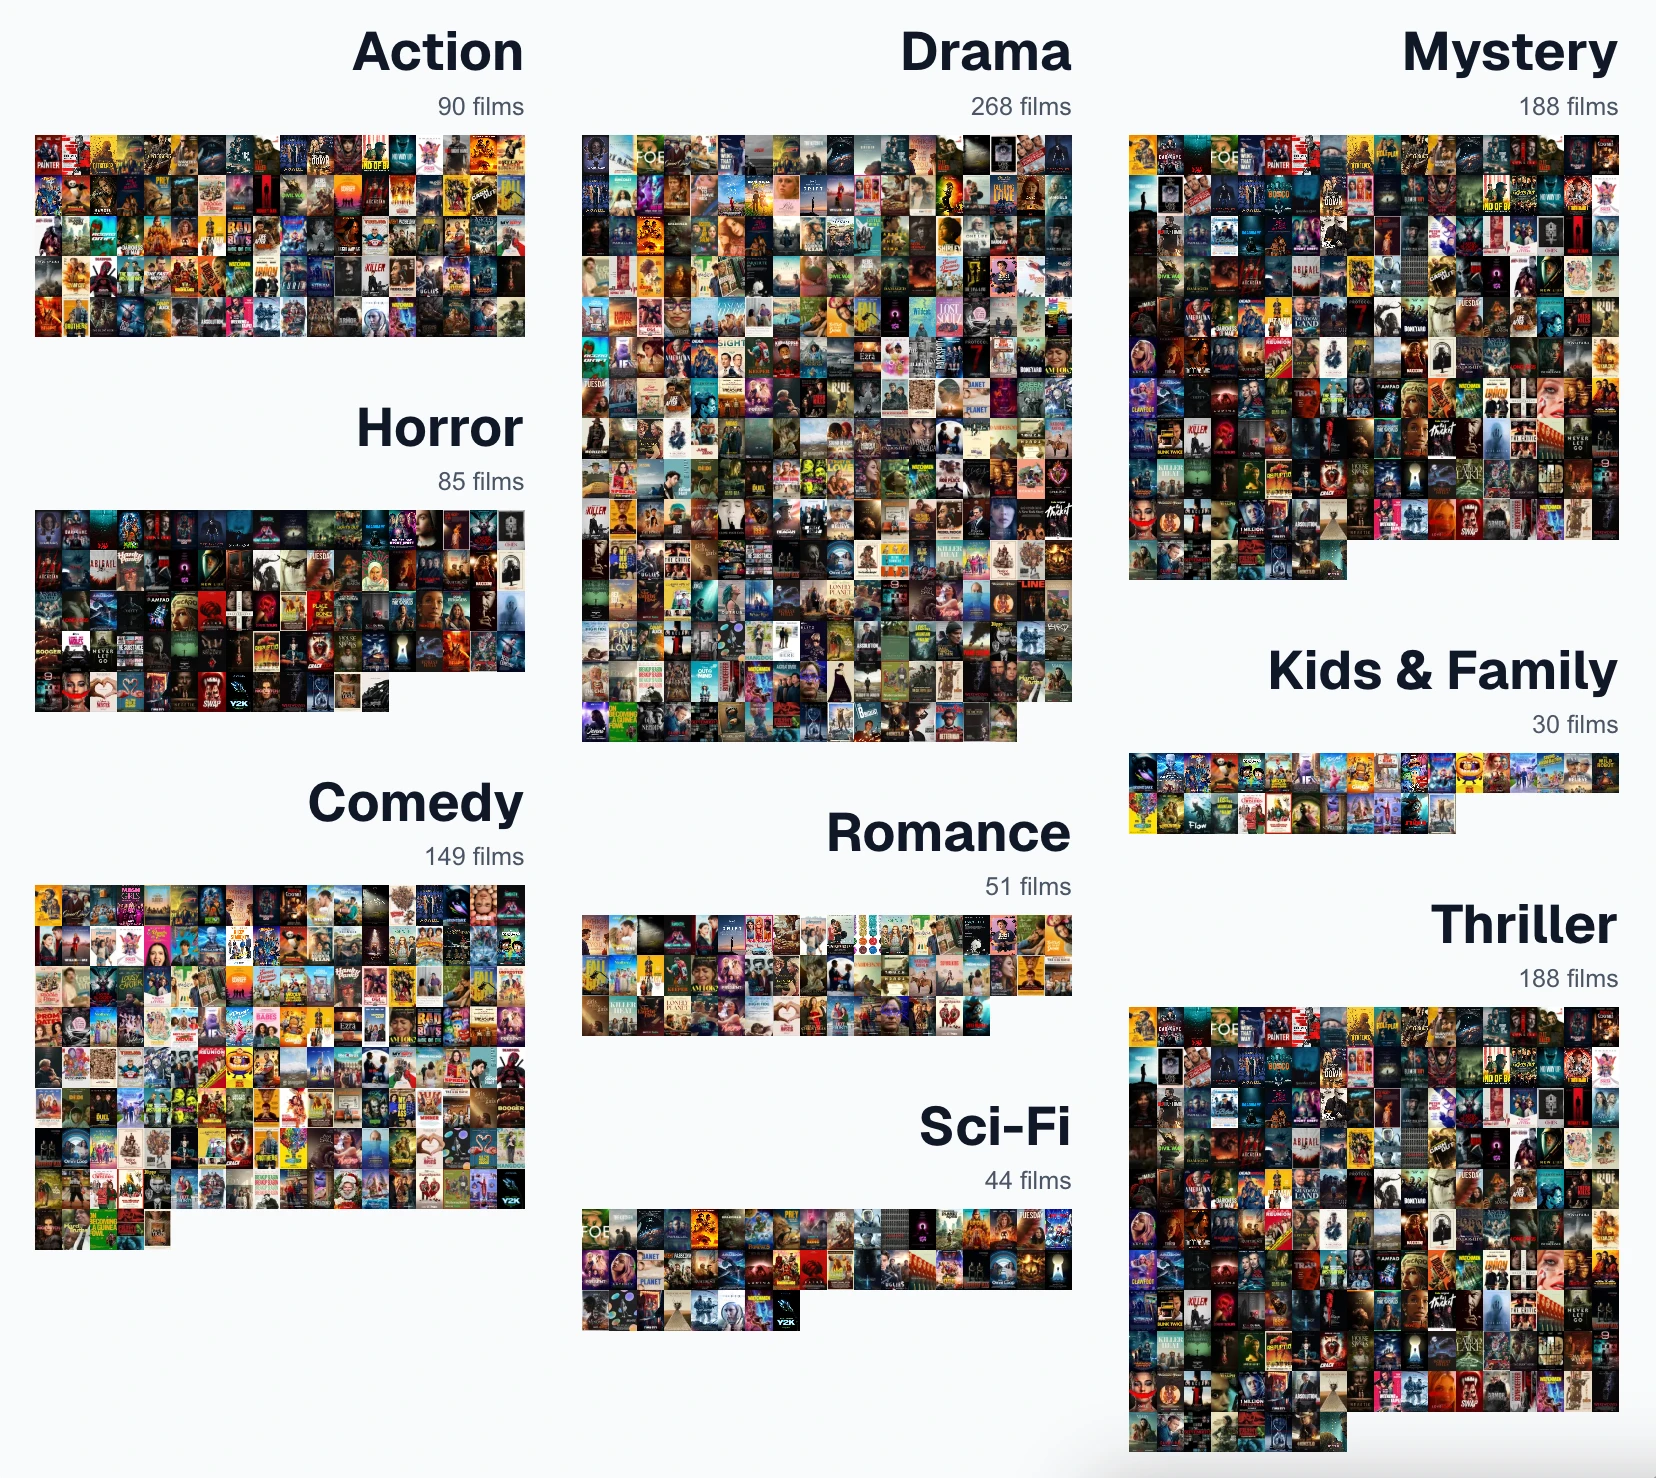
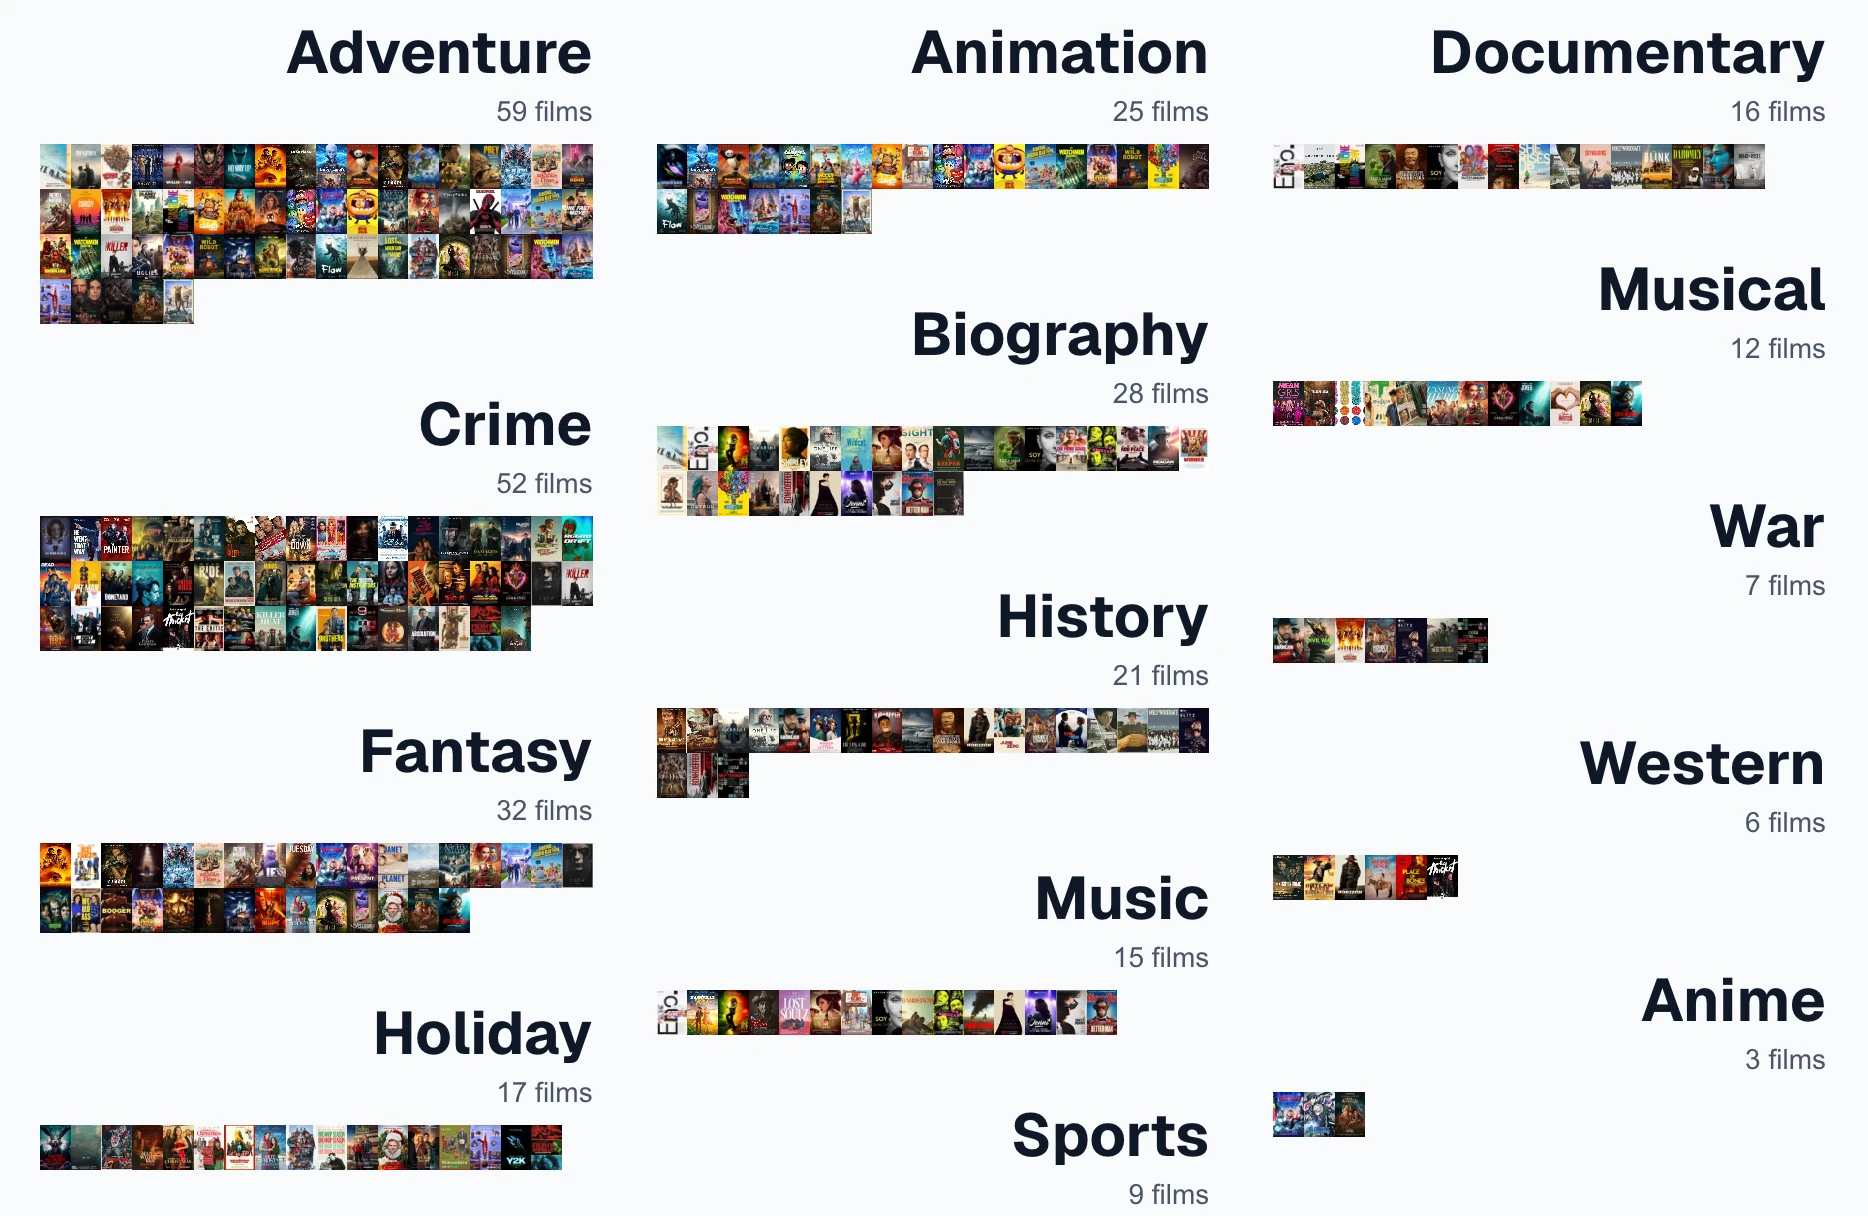
573 films came out this year. I’ve only seen 12. So I visualized every domestic + international release. Select your favorites to get a watchlist.
Dataset
Inspired by my work on Skyscraper, I scraped Wikipedia then IMDb.
Genre subjectivity problem
- Classification is inconsistent at the source. IMDb lets filmmakers self-tag, so the same film might be “Thriller” on one platform and “Drama” on another. Wikipedia editors make their own calls. Lots of conflicts.
- Genres don’t tile cleanly. A film like Everything Everywhere All at Once is action, sci-fi, comedy, drama, and family — simultaneously. Any viz that puts films in a single genre bucket misrepresents most of them.
- The long tail of subgenres makes patterns invisible. With 90+ subgenres / hybrids, you end up with 40 genres that have 1–3 films each. No clusters or trends emerge.
Potential solutions
- Collapse to 8 macro-genres. Overlap explicitly, Venn-style or bubble cluster.
- Use rating + runtime as primary axes instead of genre. Genre becomes a filter or color, not the structure. This sidesteps the subjectivity problem since ratings and runtime are objective.
- Let users define genre affinity through the films they’ve seen — infer taste from those picks rather than trusting the genre tags.
- Turn every movie into a point in 3,000 dimensional space using Gemini Vector Embeddings. Saw this done by @mike_from_flick on Instagram and helps find clusters better. He uses the Leiden community detection algorithm. Then clusters the clusters to remove vagueness. It’s cool but doesn’t work well for recent releases because the LLM has a knowledge cutoff.

Takeaways
- Wow, America still loves its thrillers, actions, and dramas.
- My categories were a construct, not fact. Genre feels like a property a film has, but it’s actually a label humans assign. I was studying the opinions of whoever did the tagging. Statisticians call these soft or latent variables — the thing I’m trying to measure (a film’s “genre-ness”) is real but not directly observable, so you approximate it with a proxy that introduces noise.
Side note: data journalism to business intelligence pipeline
I actually started this project for a specific reason. The amount of NYT/WaPo data journalists that Netflix poaches caught my eye. Allegedly, one of the key components to Netflix’s success is dataviz. But what is so valuable about it? What insights were hiding?
- Creating TV shows based on consumers’ tastes and preferences?
- Helping employees make sense of large volumes of data and generate actionable insights that are relevant for anyone, regardless of what level of decision-making hierarchy they are in??
Now that I think about it, even NYT Games (shoutout DIG) has their own viz team to better understand their own data, even though they’re often siloed under analytics. I think that’s cool from a business perspective. And nice that journalists’ and editors’ skills have been helpful.
If you are an ex-journalist who has made a similar exit, I’d love to chat! Reach out at maximsloe@gmail.com